Amazon Search Query Performance and Search Catalog Performance Dashboard Tips
The Amazon Search Query Performance and Search Catalog Performance Dashboards give sellers a lot of visibility into how shoppers search for and purchase their products on Amazon. This page is only available for Brand Registered Seller Central Users. The new program was announced at Amazon Accelerate in Q4 of 2021. It will be most helpful to sellers with larger data sets since the longer the time period the more accurate data typically is. It is recommended to look at these reports on a monthly to a quarterly basis for more accurate and insightful information. Below we will cover Amazon Search Query Performance and Search Catalog Performance Dashboards and how you can use them to your advantage. Both dashboards have the goal of laying out a sales funnel from impression to checkout and both report the same attributes. Query reports the data based on search and Catalog Performance reports the data based on ASIN.
Amazon’s Search Query Performance Dashboard
Amazon’s Search Query Performance Dashboard allows brands to see their search term's performance based on shoppers' search behavior. The data provides information on customers as they move through the sales funnel and the percentage share that you are capturing as a brand. For each search term, you are able to see the Rank and the Search Volume. Following that, this report breaks down the information into a Search Funnel for Impressions, Clicks, Cart adds, and Purchases. Each of these Search Funnels then has a variety of data points including a total count, your brand’s count, your brand’s share, the average price, and more. This data is further customizable as we will share below.
It is important to note that the sales totals may not match the total count from your sales reports as these sales totals only include those originating from the search results page. This does not include any sales that are generated through widgets or detail pages.
Using Amazon's Search Query Performance Dashboard
This Search Query Performance Dashboard has information that can be useful for determining how your brand is appearing in searches on average across the entire catalog, and how Amazon Customers view the brand's value proposition (review rank column). Another useful insight that can be gained from the report is the Brand Share %, which shows how much of the total impressions, clicks, cart ads, or purchases your brand is collecting out of the total for that search term. This insight is useful for determining the brand's ability to expand visibility and sales for specific searches, and understanding how much market share is being captured by competitors. By comparing the Brand Share % for Impressions vs. the Brand Share % for Clicks you can determine if you’re ur Click Through Rate is performing above or below average for the search. Higher Impressions vs. Clicks would indicate a below-average CTR, whereas Lower Impressions vs. Clicks would indicate an above-average CTR. The image below displays all the custom data points you include in the report.
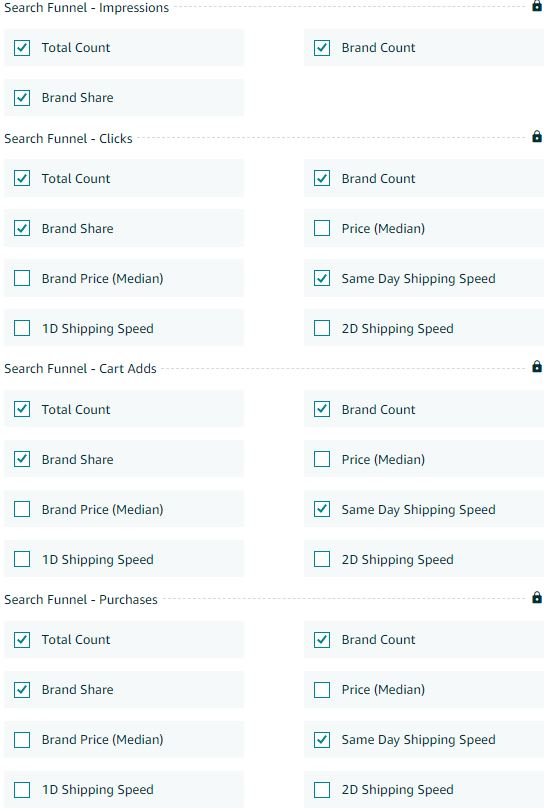
Source: Amazon.com
Amazon's Search Catalog Performance Dashboard
Amazon's Search Catalog Performance Dashboard allows sellers to see their catalog's performance broken down by ASIN. This tab allows you to see every stage of the customer's shopping journey. The data provides information on customers as they move through the sales funnel on a certain product offered by your brand. For each product, this report breaks down the information into a Search Funnel for Impressions, Clicks, Cart Adds, and Purchases. Each of these Search Funnels then has a variety of data points such as the total count, the average price, average rating, conversion rate, and more. This data is also customizable as we will share below. Like the Search Query Performance report, the purchases and sales totals may not necessarily match the total from your sales reports since these metrics only include those that originated from the search results page.
Using Amazon's Search Catalog Performance Dashboard
There are many ways you can gain value and insights from this ASIN-level Search Funnel data. It is worth noting, that some of these data points and insights can also be collected from Child ASIN Detail Page Sales Reports (Impressions, Clicks/Page Views, and Units Sold). However, the “Cart Add” and “Shipping Speed” data is unique. If you are already seeing a low conversion rate on your listings it may be worth looking into this report to determine if the issue is a low percentage of customers that are adding the product to the cart or if the issue is a high percentage of customers are failing to check out once the product is added to the cart. Once you know that, you can assess the detail page and update it accordingly. For example, if there are few cart adds, maybe your detail page needs more images and information on the product. This report also provides insight into the average delay of checkout for a product. If the Add to Cart is higher for a period than the purchases that indicates that either customer is abandoning the cart or they are delaying purchase conversion of the cart to potentially further consider the purchase. If there are many cart adds but few purchases, consider offering a sales price or coupon to incentivize sales. The image below displays all the custom data points you include in this report.
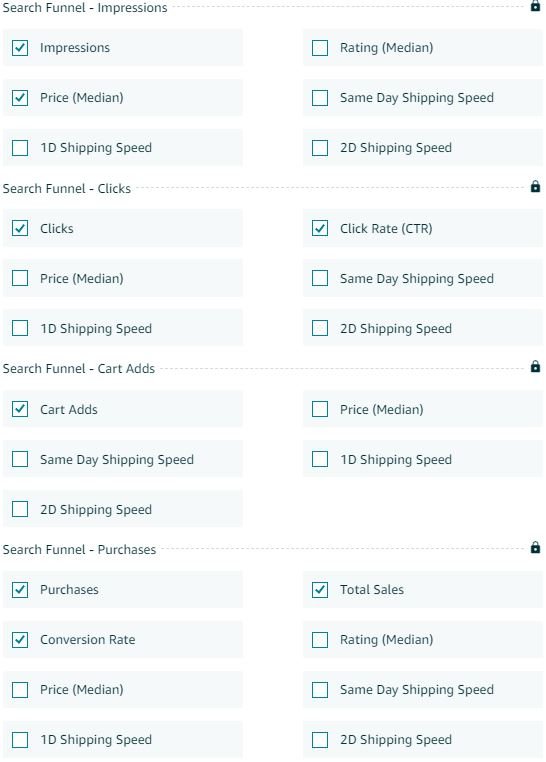
Source: Amazon.com
Conclusion
The Amazon Search Query Performance and Search Catalog Performance Dashboards give sellers a lot more information about how shoppers purchase their products on Amazon, and how they are interacting through a Search Funnel. All sellers should be using this information to help quantify the customer's purchase journey and then optimize for it. These metrics can provide key insights on what product details may need improvements. If you have any questions about Amazon Search Query Performance and Search Catalog Performance Dashboards or how to use this data to improve your product pages please click the contact us button below.